


The graph and table below give information about water use worldwide
My Sample:
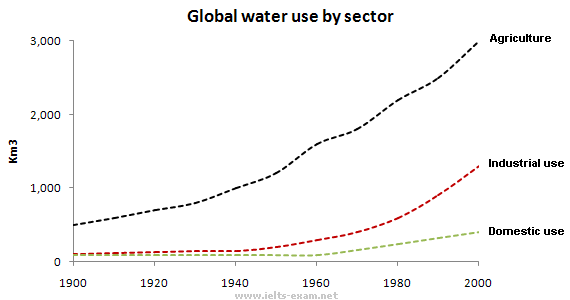
The line graph portrays the water use worldwide 1900 to 2000. It is divided into three types of sectors which vary agriculture, industrial use and domestic use.
First of all, the number of global water use by agriculture showed an upward trend. Over the period of a decade, the number of global water use increased gradually. In 1900, the number of global use by agriculture was about 100 km3. It rose moderately to approximately 1800 km3 in 1960. Then, the global water use by agriculture peaked in 2000. Next, domestic use was the lowest global water use. The global water use by domestic use remained the same from year 1990 to 1980. The number climbed slightly from about 100 km3 to approximately 500 km4 in 2000.
Generally, the global water use by agriculture went up over the period of 10 years. The least use of global water was domestic use from 1900 to 2000.
(154 words)
p/s:Correct me if i am mistake
0 comments:
Post a Comment